hds-react-timeline
Interactive timeline visualization for HDS event data. Used in the Doctor Dashboard for patient data browsing.
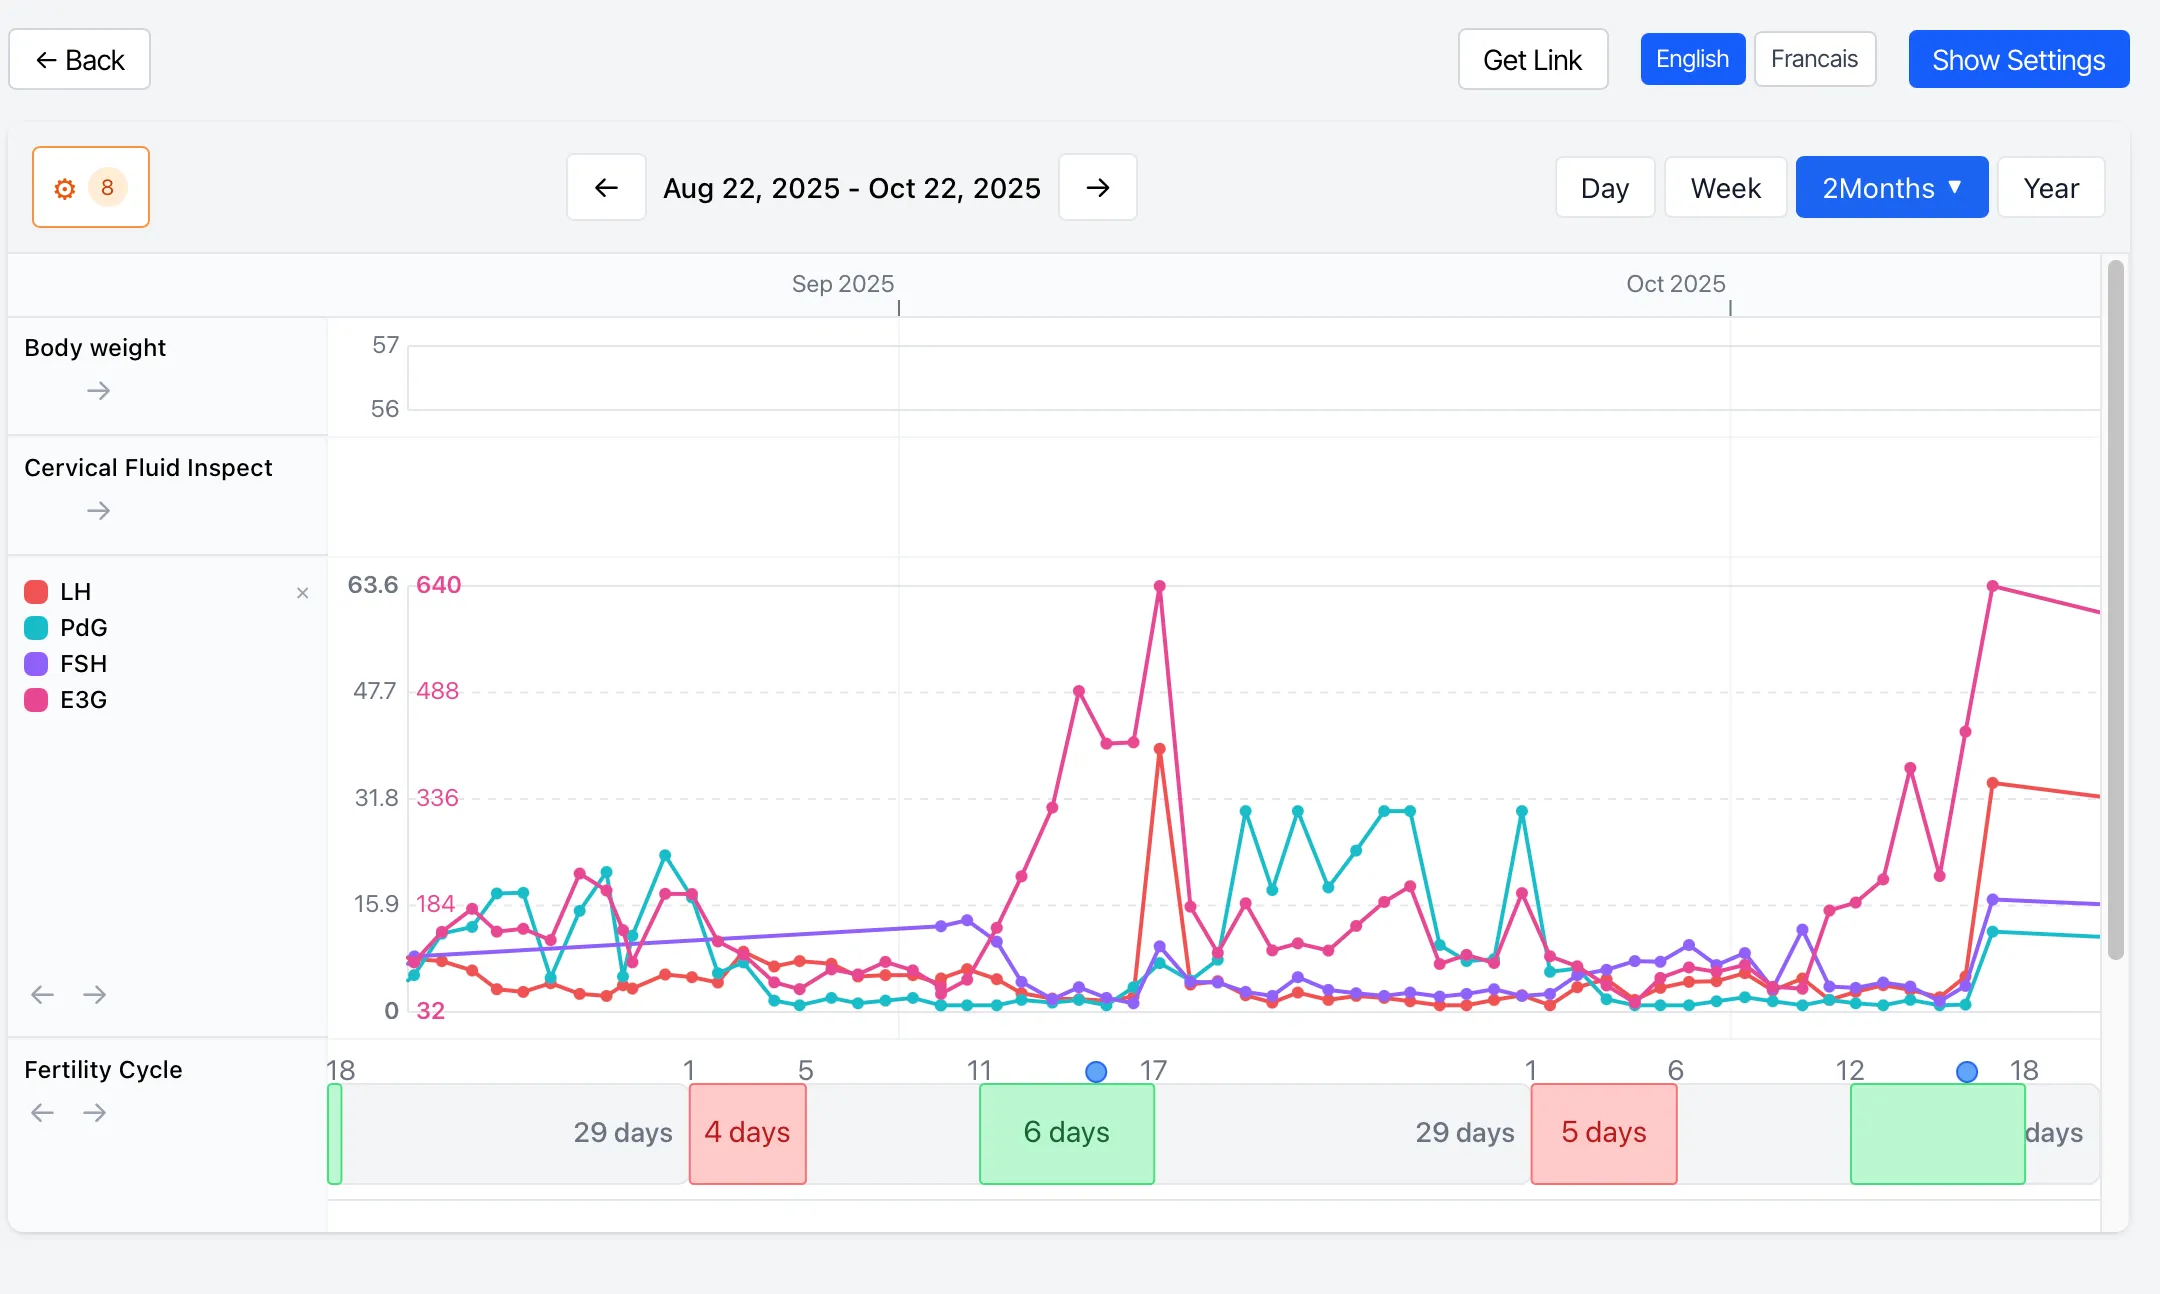
Features
Section titled “Features”- Numeric graphs with Y-axis scaling
- Event markers for discrete events
- Note and image display
- Fertility cycle graph
- Row merging and reordering
- Drag-to-zoom timeframe navigation
Package Info
Section titled “Package Info”- React component library, pre-built via Vite
- Externalizes react, hds-lib